Java JDK has many tools bundled into it. Needles to say java.exe and javac.exe are used by all developers and can be easily counted as popular Java tools. Along with these there are many tools Java JDK presents us. Most of those tools are never used by a normal Java developer. If they are put into effective use, they can save lot of productive hours.
Following is a screen shot of tools present in the Java SE 8 JDK. They are there for a purpose and as a Java developer we should know about them. I have listed the Java tools available in JDK in the previous tutorial. To help you start with, I am presenting you 5 tools that I feel are most important from them.

It’s a conscious decision to omit java, javac, jar, javadoc from the 5 JDK tools to know. Similarly jvisualvm, jcmd combines many tools into one.
javap is a Java class file disassembler. Let us compile the following Hello World Java program and disassemble it.
public class HelloWorld {
	public static void main(String... args) {
		System.out.println("Hello World!");
	}
}
C:\Users\Cycle\Desktop>javap HelloWorld
I just ran the javap tool without passing any additional parameters and got the following output. By default it prints the package, protected, public fields and methods of the Java class.
Compiled from "HelloWorld.java"
public class HelloWorld {
  public HelloWorld();
  public static void main(java.lang.String...);
}
C:\Users\Cycle\Desktop>javap -c HelloWorld
If we pass –c as argument to javap, then we get the byte code as output. This is nice information, the instructions that are printed help us to learn JVM better.
Compiled from "HelloWorld.java"
public class HelloWorld {
  public HelloWorld();
    Code:
       0: aload_0
       1: invokespecial #1                  // Method java/lang/Object."":()V
       4: return

  public static void main(java.lang.String...);
    Code:
       0: getstatic     #2                  // Field java/lang/System.out:Ljava/io/PrintStream;
       3: ldc           #3                  // String Hello World!
       5: invokevirtual #4                  // Method java/io/PrintStream.println:(Ljava/lang/String;)V
       8: return
}
jvisualvm is a Java virtual machine monitoring and profiling tool. This provides a graphical interface and provides the runtime information of Java applications in visual manner. This actually combines many tools like jmap, jinfo, jstat, jstack, JConsole into one. jvisualvm was made available with standard Java distribution from JDK 6 Update 7.
Under the hood, it uses these tools to gather information and present in a visual manner. There are plug-ins available that enhances its features. It is a handy tool when we troubleshoot a Java application that is having performance issues. MBeans functionality is useful in many a situations and it can be enabled by installing a plug-in.
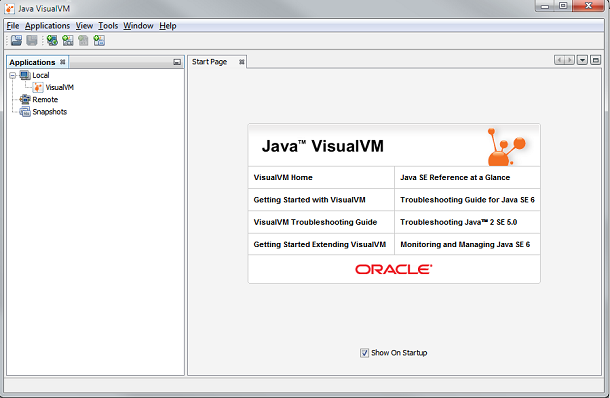
In a pervious tutorial about Java garbage collection monitoring and analysis, I used jvisualvm. You can have a look at it to know how to use jvisualvm.
jcmd is used to send diagnostic command request to the Java JVM. When we run jcmd without arguments it lists the JVM processes that are running at the moment. This is equal to the jps tool. I started jconsole and then used it to get the following output by passing it as argument to jcmd. It can also be done via the process id (pid).
C:\Users\Cycle>jconsole

C:\Users\Cycle>jcmd JConsole help
3344:
The following commands are available:
JFR.stop
JFR.start
JFR.dump
JFR.check
VM.native_memory
VM.check_commercial_features
VM.unlock_commercial_features
ManagementAgent.stop
ManagementAgent.start_local
ManagementAgent.start
Thread.print
GC.class_stats
GC.class_histogram
GC.heap_dump
GC.run_finalization
GC.run
VM.uptime
VM.flags
VM.system_properties
VM.command_line
VM.version
help
C:\Users\Cycle>jcmd JConsole VM.uptime
3344:
289.977 s
I grabbed the above argument from the help output just listed above. VM.uptime shows the uptime of the Java application.
Following arguments give the thread stack dump with the concurrent locks and it can be useful while debugging.
jcmd <pid> Thread.print -l
jhat is Java heap analysis tool. It is used to parse and browse a heap dump file. Sometimes jhat is preferable over the visual tools. jhat parses the heap dump and launches a webserver. Then we can browse the dump in a browser. jhat supports object query language (oql) and also some pre-designed queries. Help for OQL can be obtained by
http://localhost:7000/oql/
http://localhost:7000/oqlhelp/
jmap tool to generate heap dump. We should use the -dump option. Following are the available options for the jhat tool.
C:\Users\Cycle>jhat -help Usage: jhat [-stack] [-refs ] [-port ] [-baseline ] [-debug ] [-version] [-h|-help] -J Pass directly to the runtime system. For example, -J-mx512m to use a maximum heap size of 512MB -stack false: Turn off tracking object allocation call stack. -refs false: Turn off tracking of references to objects -port : Set the port for the HTTP server. Defaults to 7000 -exclude : Specify a file that lists data members that should be excluded from the reachableFrom query. -baseline : Specify a baseline object dump. Objects in both heap dumps with the same ID and same class will be marked as not being "new". -debug : Set debug level. 0: No debug output 1: Debug hprof file parsing 2: Debug hprof file parsing, no server -version Report version number -h|-help Print this help and exit The file to read For a dump file that contains multiple heap dumps, you may specify which dump in the file by appending "# " to the file name, i.e. "foo.hprof#3". All boolean options default to "true"
I created a heap dump file for the jconsole application that is running with process id 3344 using the following command.
jmap -dump:format=b,file=heap.bin 3344
Now the heap file is ready and to analyze it, run the following command and it will start a server
jmap -dump:format=b,file=heap.bin 3344
Following will be the output in the console
C:\Users\Cycle\Desktop>jhat heap.bin
Reading from heap.bin...
Dump file created Sun Nov 16 19:26:35 IST 2014
Snapshot read, resolving...
Resolving 641209 objects...
Chasing references, expect 128 dots..................
Eliminating duplicate references.....................
Snapshot resolved.
Started HTTP server on port 7000
Server is ready.
Now, go to the following URL in a browser
http://localhost:7000/
Now we can navigate and get details from the heap dump. For example, the heap memory histogram can be analyzed at http://localhost:7000/histo/

As part of the JVM convergence strategy which is to unify the HotSpot, JRockit VMs, the JRockit Mission Control is now available with the standard Java SE. It was made available in Java JDK 7 Update 40. An important thing to note is the license agreement. It is free for development and evaluation use. For production use, a license is required from Oracle. This can be considered as a super-set tool for all analysis and debug purposes.
Java mission control works along with the Java Flight Recorder. This is available with the HotSpot JVM and it records key statistics and events. It is a profiling tool and available with the Oracle JDK. When there is an issue, this data can be used for analysis. Since the JMC utilizes the Java Flight Recorder data, it has a minimal footprint. JFR is the one that forces the production license use. Using JFR on a production server requires a commercial license. Let see if Oracle will makes it free in future.
Launch Java Mission Control tool with the command jmc


Comments are closed for "5 JDK Tools Every Java Developer Should Know".
Thank you for this great and clean article Joe.
no words to comment its very use full for java fresher
Thank you for ‘jvisualvm’.
Nice
A big Thank you
So Simple… yet so powerful. Great tools !!
Thanks a lot Joe