Android Chart Example APP using MPAndroidChart
This tutorial is to help you learn chart view by developing an Android chart example APP using the library MPAndroidChart. It is a free Android chart view / graph view library using which you can draw line, bar, pie, radar, bubble, candlestick charts.
There are times when we deal with large datasets. In those scenarios, it is quite useful to use charts and graphs to get visual representation of data. In Android world, charts can be easily built using various libraries.

MPAndroidChart also supports scaling, dragging and animations. It is a popular library available via GitHub. Earlier I have published another tutorial for creating Android APPs with chart using AndroidPlot, you can refer that for alternate library.
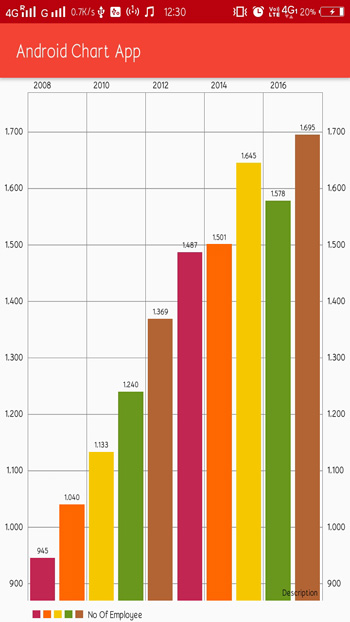
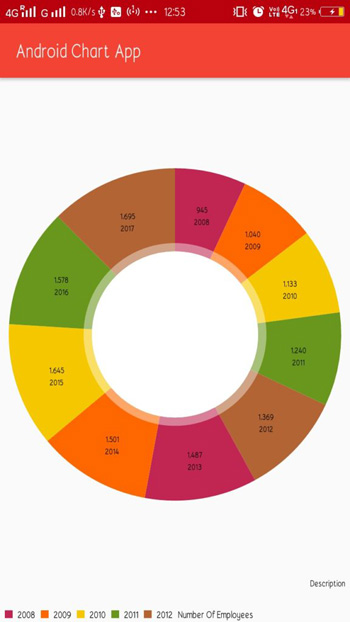
In this Android chart example tutorial, I will demonstrate how to use MPAndroidChart library by building a demo Android App. We’ll create an example Android chart application which will display year wise strength of employees in an organization. Also, we will build a bar and a pie chart of same data.
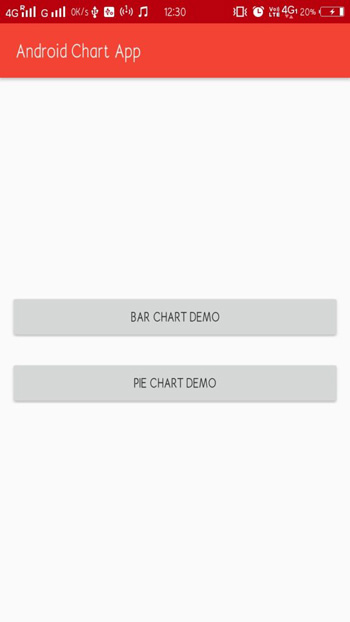
Android Chart Example App
In this Android chart example, we will need two separate activities, one for Bar Chart and one for Pie Chart. In the main Android activity we’ll add two buttons. On button click we’ll be directed to the respective activities.
Before we proceed, lets add MPAndroidChart library in our example chart app. Open Build.gradle app module file and paste the following code inside dependencies
compile 'com.github.PhilJay:MPAndroidChart:v2.2.4'
Now click on ‘Sync Now’. We have added library in our application successfully. Lets Build Layout of our Android app.
1. activity_main.xml
<?xml version="1.0" encoding="utf-8"?>
<LinearLayout xmlns:android="http://schemas.android.com/apk/res/android"
    xmlns:tools="http://schemas.android.com/tools"
    android:layout_width="match_parent"
    android:layout_height="match_parent"
    android:gravity="center"
    android:orientation="vertical"
    tools:context="com.javapapers.androidchartapp.MainActivity">

    <Button
        android:id="@+id/btnBarChart"
        android:layout_width="match_parent"
        android:layout_height="wrap_content"
        android:layout_margin="10dp"
        android:text="Bar Chart Demo" />

    <Button
        android:id="@+id/btnPieChart"
        android:layout_width="match_parent"
        android:layout_height="wrap_content"
        android:layout_margin="10dp"
        android:text="Pie Chart Demo" />

</LinearLayout>
Now create a new empty activity and name it BarChartActivity.
2. activity_bar_chart.xml
Add the following code in layout file of BarChart activity.
<?xml version="1.0" encoding="utf-8"?>
<LinearLayout xmlns:android="http://schemas.android.com/apk/res/android"
    xmlns:tools="http://schemas.android.com/tools"
    android:layout_width="match_parent"
    android:layout_height="match_parent"
    android:orientation="vertical">

    <com.github.mikephil.charting.charts.BarChart
        android:id="@+id/barchart"
        android:layout_width="match_parent"
        android:layout_height="match_parent"/>

</LinearLayout>
Create one more activity for Pie chart and name it PieChartActivity.
3. activity_pie_chart.xml
Paste the following to pie chart layout file.
<?xml version="1.0" encoding="utf-8"?>
<LinearLayout xmlns:android="http://schemas.android.com/apk/res/android"
    xmlns:app="http://schemas.android.com/apk/res-auto"
    xmlns:tools="http://schemas.android.com/tools"
    android:layout_width="match_parent"
    android:layout_height="match_parent">

    <com.github.mikephil.charting.charts.PieChart
        android:id="@+id/piechart"
        android:layout_width="match_parent"
        android:layout_height="match_parent" />
</LinearLayout>
Now lets code the java files.
4. MainActivity.java
Here, we will add two buttons. We’ll set clickListeners to button and use Android Intent to launch next Activity.
package com.javapapers.androidchartapp;

import android.content.Intent;
import android.support.v7.app.AppCompatActivity;
import android.os.Bundle;
import android.view.View;
import android.widget.Button;

import com.github.mikephil.charting.charts.BarChart;

public class MainActivity extends AppCompatActivity {
    Button btnBarChart, btnPieChart;

    @Override
    protected void onCreate(Bundle savedInstanceState) {
        super.onCreate(savedInstanceState);
        setContentView(R.layout.activity_main);
        BarChart barChart = (BarChart) findViewById(R.id.barchart);

        btnBarChart = findViewById(R.id.btnBarChart);
        btnPieChart = findViewById(R.id.btnPieChart);
        btnBarChart.setOnClickListener(new View.OnClickListener() {
            @Override
            public void onClick(View view) {
                Intent I = new Intent(MainActivity.this, BarChartActivity.class);
                startActivity(I);
            }
        });
        btnPieChart.setOnClickListener(new View.OnClickListener() {
            @Override
            public void onClick(View view) {
                Intent I = new Intent(MainActivity.this, PieChartActivity.class);
                startActivity(I);
            }
        });
    }
}
5. BarChartActivity.java
We need to add data to the example Android charts. For that we will use two ArrayLists, one for year(x-axis) and another for number of employees(Y-axis). To pass data to the Android chart example we’ll need a dataset, where we will pass ArrayLists as argument.
MPAndroidChart library support various features which make Android charts attractive and appealing. To add colours to bars, i have used setColors method. To add animation, i have used animateY().
package com.javapapers.androidchartapp;

import android.support.v7.app.AppCompatActivity;
import android.os.Bundle;

import com.github.mikephil.charting.charts.BarChart;
import com.github.mikephil.charting.data.BarData;
import com.github.mikephil.charting.data.BarDataSet;
import com.github.mikephil.charting.data.BarEntry;
import com.github.mikephil.charting.interfaces.datasets.IBarDataSet;
import com.github.mikephil.charting.utils.ColorTemplate;

import java.util.ArrayList;

public class BarChartActivity extends AppCompatActivity {

    @Override
    protected void onCreate(Bundle savedInstanceState) {
        super.onCreate(savedInstanceState);
        setContentView(R.layout.activity_bar_chart);
        BarChart chart = findViewById(R.id.barchart);

        ArrayList NoOfEmp = new ArrayList();

        NoOfEmp.add(new BarEntry(945f, 0));
        NoOfEmp.add(new BarEntry(1040f, 1));
        NoOfEmp.add(new BarEntry(1133f, 2));
        NoOfEmp.add(new BarEntry(1240f, 3));
        NoOfEmp.add(new BarEntry(1369f, 4));
        NoOfEmp.add(new BarEntry(1487f, 5));
        NoOfEmp.add(new BarEntry(1501f, 6));
        NoOfEmp.add(new BarEntry(1645f, 7));
        NoOfEmp.add(new BarEntry(1578f, 8));
        NoOfEmp.add(new BarEntry(1695f, 9));

        ArrayList year = new ArrayList();

        year.add("2008");
        year.add("2009");
        year.add("2010");
        year.add("2011");
        year.add("2012");
        year.add("2013");
        year.add("2014");
        year.add("2015");
        year.add("2016");
        year.add("2017");

        BarDataSet bardataset = new BarDataSet(NoOfEmp, "No Of Employee");
        chart.animateY(5000);
        BarData data = new BarData(year, bardataset);
        bardataset.setColors(ColorTemplate.COLORFUL_COLORS);
        chart.setData(data);
    }
}
6. PieChartActivty.java
Code for Android pie chart is almost same to that of bar chart. Here, again we’ll use two ArrayLists and a dataSet. We’ll add animation and colors too.
package com.javapapers.androidchartapp;

import android.support.v7.app.AppCompatActivity;
import android.os.Bundle;

import com.github.mikephil.charting.charts.PieChart;
import com.github.mikephil.charting.data.BarEntry;
import com.github.mikephil.charting.data.Entry;
import com.github.mikephil.charting.data.PieData;
import com.github.mikephil.charting.data.PieDataSet;
import com.github.mikephil.charting.formatter.PercentFormatter;
import com.github.mikephil.charting.utils.ColorTemplate;

import java.util.ArrayList;

public class PieChartActivity extends AppCompatActivity {

    @Override
    protected void onCreate(Bundle savedInstanceState) {
        super.onCreate(savedInstanceState);
        setContentView(R.layout.activity_pie_chart);
        PieChart pieChart = findViewById(R.id.piechart);
        ArrayList NoOfEmp = new ArrayList();

        NoOfEmp.add(new Entry(945f, 0));
        NoOfEmp.add(new Entry(1040f, 1));
        NoOfEmp.add(new Entry(1133f, 2));
        NoOfEmp.add(new Entry(1240f, 3));
        NoOfEmp.add(new Entry(1369f, 4));
        NoOfEmp.add(new Entry(1487f, 5));
        NoOfEmp.add(new Entry(1501f, 6));
        NoOfEmp.add(new Entry(1645f, 7));
        NoOfEmp.add(new Entry(1578f, 8));
        NoOfEmp.add(new Entry(1695f, 9));
        PieDataSet dataSet = new PieDataSet(NoOfEmp, "Number Of Employees");

        ArrayList year = new ArrayList();

        year.add("2008");
        year.add("2009");
        year.add("2010");
        year.add("2011");
        year.add("2012");
        year.add("2013");
        year.add("2014");
        year.add("2015");
        year.add("2016");
        year.add("2017");
        PieData data = new PieData(year, dataSet);
        pieChart.setData(data);
        dataSet.setColors(ColorTemplate.COLORFUL_COLORS);
        pieChart.animateXY(5000, 5000);
    }
}
Now lets run and test the application.
Android Chart Example Application Output

Android Bar Chart Example

Android Pie Chart Example

Download Android Chart Example App
Comments on "Android Chart Example APP using MPAndroidChart"
Comments are closed for "Android Chart Example APP using MPAndroidChart".


Hi. Thanks for Great article.
what if i want to change shape of barChart to rounded bar chart?
Thanks :)
Hi Mavisa,
As of the current moment MPAndroidChart library does not support rounded bar chart. But this feature is added to the “To-do List” for version 3.1.0
https://github.com/PhilJay/MPAndroidChart/projects/2#card-14276477
We can expect it anytime soon.