Android Chart using AndroidPlot
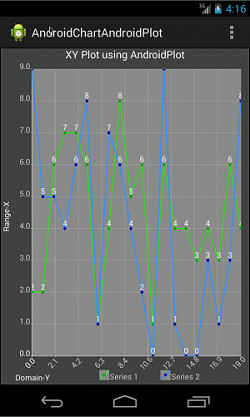
In this Android tutorial let us learn, how to create a chart in an Android app using AndroidPlot library. Creating a chart in Android is made simple by AndroidPlot, just we need to know about couple of classes. How to pass values to those classes to plot the chart and then how to style the chart using nice colors, and that’s it chart in Android is done.

In this chart example, let us see how to create a XY plot for couple of series. AndroidPlot has array of examples in its demo package which is available for downloand. AndroidPlot library provides option for many different charts like bar, pie, line, scatter, step etcetera. Similar to the number of types of chart, the style customizations provided is also plenty. I haven’t done any comparison study yet on other types of Android charting libraries available. Based on casual Googling I chose AndroidPlot and I find this to be good. I will write about other Android chart libraries in the future.
Android Chart Example using AndroidPlot
- Create an Android project.
- Download core library from AndroidPlot and add to “libs” folder. Androidplot 0.6.0 is the latest version as of now.
- Create a custom chart layout and its corresponding design parameters.
- Create a chart activity using the above layout.
Chart Activity
MainActivity.java
This example Android app gives example for XYPlot only. All other charts are very similar to this and just change the chart type API. In this chart example we have created, two line series in X-Y axis. I have used Java’s Random class to generate 20 random numbers ranging from 0 to 10. Using those generated numbers SimpleXYSeries instance is created.
package com.javapapers.androidchartandroidplot;

import java.util.ArrayList;
import java.util.List;
import java.util.Random;

import android.app.Activity;
import android.os.Bundle;
import android.view.Menu;

import com.androidplot.xy.LineAndPointFormatter;
import com.androidplot.xy.PointLabelFormatter;
import com.androidplot.xy.SimpleXYSeries;
import com.androidplot.xy.XYPlot;
import com.androidplot.xy.XYSeries;

public class MainActivity extends Activity {

	private XYPlot plot;

	@Override
	protected void onCreate(Bundle savedInstanceState) {
		super.onCreate(savedInstanceState);
		setContentView(R.layout.xy_plot_chart);
		plot = (XYPlot) findViewById(R.id.xyPlot);

		List s1 = getSeries(20, 10);
		XYSeries series1 = new SimpleXYSeries(s1,
				SimpleXYSeries.ArrayFormat.Y_VALS_ONLY, "Series 1");

		List s2 = getSeries(20, 10);
		XYSeries series2 = new SimpleXYSeries(s2,
				SimpleXYSeries.ArrayFormat.Y_VALS_ONLY, "Series 2");

		LineAndPointFormatter s1Format = new LineAndPointFormatter();
		s1Format.setPointLabelFormatter(new PointLabelFormatter());
		s1Format.configure(getApplicationContext(),
				R.xml.lpf1);
		plot.addSeries(series1, s1Format);

		LineAndPointFormatter s2Format = new LineAndPointFormatter();
		s2Format.setPointLabelFormatter(new PointLabelFormatter());
		s2Format.configure(getApplicationContext(),
				R.xml.lpf2);
		plot.addSeries(series2, s2Format);

		plot.setTicksPerRangeLabel(1);
		plot.getGraphWidget().setDomainLabelOrientation(-45);

	}

	@Override
	public boolean onCreateOptionsMenu(Menu menu) {
		getMenuInflater().inflate(R.menu.main, menu);
		return true;
	}

	private List getSeries(int count, int max) {
		List series = new ArrayList();
		Random rand = new Random();
		for (int i = 1; i <= count; i++) {
			int value = rand.nextInt(max);
			series.add(rand.nextInt(max));
		}
		return series;
	}
}
Chart Design
A custom layout element using com.androidplot.xy.XYPlot
xy_plot_chart.xml
<?xml version="1.0" encoding="utf-8"?>
<LinearLayout xmlns:android="http://schemas.android.com/apk/res/android"
              style="@style/sample_activity">

    <com.androidplot.xy.XYPlot
            android:id="@+id/xyPlot"
            android:layout_width="fill_parent"
            android:layout_height="fill_parent"
            androidPlot.title="XY Plot using AndroidPlot"
            androidPlot.domainLabel="Domain-Y"
            androidPlot.rangeLabel="Range-X"
            androidPlot.titleWidget.labelPaint.textSize="@dimen/title_font_size"
            androidPlot.domainLabelWidget.labelPaint.textSize="@dimen/domain_label_font_size"
            androidPlot.rangeLabelWidget.labelPaint.textSize="@dimen/range_label_font_size"
            androidPlot.graphWidget.marginTop="20dp"
            androidPlot.graphWidget.marginLeft="15dp"
            androidPlot.graphWidget.marginBottom="25dp"
            androidPlot.graphWidget.marginRight="10dp"
            androidPlot.graphWidget.rangeLabelPaint.textSize="@dimen/range_tick_label_font_size"
            androidPlot.graphWidget.rangeOriginLabelPaint.textSize="@dimen/range_tick_label_font_size"
            androidPlot.graphWidget.domainLabelPaint.textSize="@dimen/domain_tick_label_font_size"
            androidPlot.graphWidget.domainOriginLabelPaint.textSize="@dimen/domain_tick_label_font_size"
            androidPlot.legendWidget.textPaint.textSize="@dimen/legend_text_font_size"
            androidPlot.legendWidget.iconSizeMetrics.heightMetric.value="15dp"
            androidPlot.legendWidget.iconSizeMetrics.widthMetric.value="15dp"
            androidPlot.legendWidget.heightMetric.value="25dp"
            androidPlot.legendWidget.positionMetrics.anchor="right_bottom"
            androidPlot.graphWidget.gridLinePaint.color="#000000"/>
</LinearLayout>
dimens.xml
<resources>

    <!-- Default screen margins, per the Android Design guidelines. -->
    <dimen name="activity_horizontal_margin">16dp</dimen>
    <dimen name="activity_vertical_margin">16dp</dimen>
    <dimen name="title_font_size">16dp</dimen>
    <dimen name="domain_label_font_size">12dp</dimen>
    <dimen name="range_label_font_size">12dp</dimen>
    <dimen name="range_tick_label_font_size">12dp</dimen>
    <dimen name="domain_tick_label_font_size">12dp</dimen>
    <dimen name="legend_text_font_size">12dp</dimen>
</resources>
style.xml
<resources xmlns="http://schemas.android.com/apk/lib/com.androidplot.xy">
    <style name="sample_activity">
        <item name="android:layout_width">fill_parent</item>
        <item name="android:layout_height">fill_parent</item>
    </style>

    <style name="toc_button">
        <item name="android:layout_width">fill_parent</item>
        <item name="android:layout_height">wrap_content</item>
    </style>

</resources>
lpf1.xml
<?xml version="1.0" encoding="utf-8"?>
<config
        linePaint.strokeWidth="2dp"
        linePaint.color="#42D236"
        vertexPaint.color="#00AA00"
        fillPaint.color="#00000000"
        pointLabelFormatter.textPaint.color="#FFFFFF"/>
lpf2.xml
<?xml version="1.0" encoding="utf-8"?>
<config
        linePaint.strokeWidth="2dp"
        linePaint.color="#4290F9"
        vertexPaint.color="#0000AA"
        fillPaint.color="#00000000"
        pointLabelFormatter.textPaint.color="#FFFFFF"/>
Download Android Chart App
Comments on "Android Chart using AndroidPlot"
Comments are closed for "Android Chart using AndroidPlot".


Just Suuupperrrbb… (y)
hey in this sample code i am getting layout inflater exception in com.androidplot.xy.XYPlot
this library is awesome and so is your article
hello bro.
very nice
but i have problem when i run it!
it tell me there is problem and the program is stopped
please can you help me with that
and thank you again
Hello
is there a way to change background color of this chart?
change the android version to a new one by right clicking the project and selecting properties. it will work.it worked for me
Very good Article!!!
Thanks its very useful , its working
hello,
thank you so much for giving awesome code about androidPlot…
by using this code i realize that, we cant add graph to XYPlot from outside the onCreate()…
and i have problem while adding zoom functionality…
so please any code have please let me know….
regards
rajan nalawade
This code fails to build. It cannot resolve the 2 xml files, the menu file and the main layout file and the id ‘xyPlot’. Using min SDK 19, target 21, MyEclipse 2014.
Can’t imagine sdk versions are implicated.
Hello. How can i save the graph?.
i found a solution:
plot = (XYPlot) findViewById(R.id.pot);
plot.layout(0, 0, 400, 200);
XYSeries series = new SimpleXYSeries(Arrays.asList(array1),Arrays.asList(array2),”series”);
LineAndPointFormatter seriesFormat = new LineAndPointFormatter();
seriesFormat.setPointLabelFormatter(new PointLabelFormatter());
plot.addSeries(series, seriesFormat);
plot.setDrawingCacheEnabled(true);
FileOutputStream fos = new FileOutputStream(“/sdcard/DCIM/img.png”, true);
plot.getDrawingCache().compress(CompressFormat.PNG, 100, fos);
fos.close();
plot.setDrawingCacheEnabled(false);